Research Article | | Peer-Reviewed

Pixel Computer Aided Design (CAD) Method to Understand Mass Measurements, Imaging in Milli, Micro and Nanometer Resolution

Received: 2 January 2026     Accepted: 13 January 2026     Published: 30 January 2026
Views:       Downloads:
Abstract

In this article we measure the steady mass for our samples polyvinyl chloride and polyethylene. The constant mass is achieved when the acrylic box is used to shield the precision mass balance. The mass of our sample 1 polyvinyl chloride is 160 mg. Our sample 1 polyvinyl chloride is thin film of length 5.5 mm, width 7 mm and thickness 3.2 mm. The density of the polyvinyl chloride is 1300 kg/m3 in agreement with the literature. The stream flow is blocked when the acrylic shield is used. We observe fluctuations in the mass from 320 mg to 560 mg when there is no acrylic shield. The mass of our sample 2 polyethylene is 120 mg and the density is 893 kg/m3 with the acrylic shield. The mass of the polyethylene membrane material fluctuates from 60 mg to 350 mg without the acrylic shield. The geometry of our sample 2 polyethylene is length 14 mm, width 12 mm and thickness 0.8 mm. Further we build pixel computer aided design (CAD) model to correlate with the chemical elements in the periodic table towards exact match with the optical camera image of our two samples that are polyvinyl chloride and polyethylene. Furthermore we build the model to exact match to the scanning electron microscopy (SEM) in micrometer and nanometer resolution to both samples. The chemical periodic table elements are obtained from energy dispersive spectroscopy (EDS). The study of membrane materials can find applications towards energy and thermal management coolants.

Published in International Journal of Materials Science and Applications (Volume 15, Issue 1)
DOI 10.11648/j.ijmsa.20261501.12
Page(s) 15-25
Creative Commons

This is an Open Access article, distributed under the terms of the Creative Commons Attribution 4.0 International License (http://creativecommons.org/licenses/by/4.0/), which permits unrestricted use, distribution and reproduction in any medium or format, provided the original work is properly cited.

Copyright

Copyright © The Author(s), 2026. Published by Science Publishing Group

Keywords

Computer Aided Design (CAD), Pixel Imaging, Scanning Electron Microscopy (SEM), Polyvinyl Chloride, Polyethylene

1. Introduction
In recent years advanced materials to understand thermodynamic property chart of them has been gaining significant importance . The materials have been researched towards fundamental understanding of structure in other words arrangement of molecules to obtain property density mass chart . The arrangement of molecules decides the object of the material, dimensions, elements composition and resolution imaging decided by microscope for our understanding. The optical camera gives resolution of object given in millimeter scale. The object can be thick, thin, hole and concentric film. The image of the object obtained from the optical camera is partial 3D or else 2D. In order to understand the micrometer and nanometer scale arrangement of the molecules the microscope provides the user only resolution and 2D planar image in the recent years . The property of the mass density starts in the millimeter scale availability of the object. The materials in advancement from silicon, silicon dioxide, silicon nitride towards membrane materials polyethylene, polyvinyl chloride has provided the object to match experiments in mass density chart. This includes the arrangements of the molecules in the membrane materials object to be imaged from millimeter, micrometer and nanometer scales. However the knowledge of the camera to be matched from device simulations in the arrangements of the molecules is missing in the literature. In this paper we develop pixel computer aided design method for the arrangements of the molecules to match the image of the object from the millimeter, micrometer and nanometer resolution scales .
The density of polymer membrane materials are light weight that in recent years have yielded the transport with stability requirement being achievable with device to device optimization to confirm . In order to understand the structure of the polymer membrane materials we have to adjust the processing parameters in the fabrication stage with the spinning solution . The design of the time dependent thermodynamic structure dynamics of polymer membrane materials allows to understand the structure damping properties towards thermal management coolant applications . The technique to fabricate the polyvinyl chloride membrane polymer is in the recent trends to understand the structure of the polymer material . The effects of the molecular interactions are recent trends to understand the segments and complete polymer membrane materials . Polystyrene polymethyl methacrylate, polystyrene polyethylene oxide are polymers with the functional properties that are studied in the recent years with details to predict the structure, the structure dynamics to correlate the functional properties for tasks . The arrangements of the copolymers are linear to relate the use for energy applications . The solid membranes for energy products are heavily researched that includes polystyrene polyethylene oxide with its high conductivity, stable electrochemical results and excellent mechanical properties .
The property chemical stability is dependent on the periodic table of the elements, monomers, polymers, block copolymers, diblock copolymers, membranes, heterogeneous junction materials, thin films, substrates with thin films of silicon, silicon dioxide and wafers encounter the stability of the structure at the angstrom level to provide the desired design confidence. The work in this broad field of polymers, membranes and materials are of thorough interest . The seepage of the chemical elements and polymers inside the device is still unclear in the field of polymer membrane materials . The devices from atomic force spectroscopy provide the surface–chemical analysis to interaction between the elements, know the spacings of the elements with and without work function to resolve the structure details in the material . The line of the study in this direction has resulted in clean surface, well ordered structure with the density mass correlations at the multiple scales . The instrument of the scanning electron microscopy in engineering domain for the structure is two decades efforts . In particular the scanning electron microscopy is film correlation with and without the wafer needed to measure the atomic mass (%) distribution at the element and its size relation level . The synthesis of the polymers is nascent towards the study from the energy dispersive spectroscopy to select the diblock copolymers for the integration in the system device in the right composition to material stability . The thermal and ionic conductivity control of the structure in the bonding of the diblock copolymers needs the careful energy dispersive spectroscopy to obtain the dopants or elements to maneuver them at the needed concentration for energy in the device studies . The Hall coefficient and the thermopower distribution of the structural integrity polymer membrane materials rewards towards the mobility functional based drive to include or not to include the term workfunction . The necessary advancements in the dopant based study to add to the polymer membrane materials is in optical resolution new diffraction limit created by camera . The usage of the dopants to chemical tailoring is needed in advancements to camera technology . Tuning materials with the dopants are needed in the efforts to transfer elements on the thin film for high resolution imaging camera that is inexpensive . The expensive vacuum deposition is lacking towards the dopant and material control while dopant methods dopant induced solubility control (DISC) for polymer membrane materials is available that is less expensive . The addition of luminescent elements in the polymer membrane materials are efficient in the resolution of colors in the production of the patterns . The key parameters after the understanding the polymer membrane material are the structure density relation that is necessary to design of the imaging camera with and without work function .
In this paper we develop experimental technique to obtain steady mass measurement for polymer membrane materials. We consider acrylic box to shield the precision mass balance measurement. We obtain steady mass for two membrane materials polyvinyl chloride and polyethylene. The objective to obtain mass for our two samples is to understand the structure, mass, density, different elements in the periodic table represent in the polymer membrane material, elements their color, elements their shape, elements their composition of the sample, location of the elements in the sample, tailoring of the different elements at various locations in the sample, repeatability of the understanding of the structure for two samples that are polyvinyl chloride and polyethylene. In this paper we develop pixel computer aided design method to meet the objective to obtain mass for our two samples to relate the elements their color, shape, repeat the model for different elements in the periodic table present in the sample, elements their composition of the sample, location of the elements in the sample, tailoring of the different elements at various locations in the sample. The objective of the pixel computer aided design method is to ensure the optical camera image produced from the sample is matching the simulation. Our two samples polyvinyl chloride and polyethylene considered are millimeter size in the three directions. Here we simulate to understand and match the camera image in millimeter size of our sample. Here we simulate to match the microscopic imaging in micrometer and nanometer resolution of our sample polyvinyl chloride. The procedure is repeated to the second sample polyethylene.
2. Methods
We purchase the polyvinyl chloride and polyethylene from Lakshmi Electrical and Hardwares India. We purchase the precision mass balance Merck, Germany. The maximum mass is 1200 g. The precision of the mass balance is 0.01 g. The mass balance needs power supply of 230 V with the electrical plug. We fabricate the acrylic box from IITM. The camera facility is from IITM. Scanning Electron microscopy facility is used from IITM. Energy dispersive spectroscopy facility is used from IITM. The simulation is GUI based developed in python. In step 1 (Figure 1(a)) we import the shape and color of the periodic table elements. In step 2 (Figure 1(b)) we simulate the chemical tailoring of the different periodic table elements, location, color, shape and element composition present in the object. The locations of the different periodic table elements in the object are obtained from the imaging in the milli, micro and nanometer resolution. The objective function is to match the millimeter scale camera taken imaging of our sample 1 polyvinyl chloride. In this paper we develop semi 3D simulation match to camera imaging in millimeter scale for our objects. The simulation in step 2 matches the micro and nanometer resolution imaging obtained from scanning electron microscopy. The simulation matches the planar x–y direction image of the object in the micro and nanometer resolution. The code is available in the supplementary material. In step 3 (Figure 1(c)) the simulation provides the list of objects for the user needed resolution. In step 3 the simulation provides the name of each object and the geometry details.
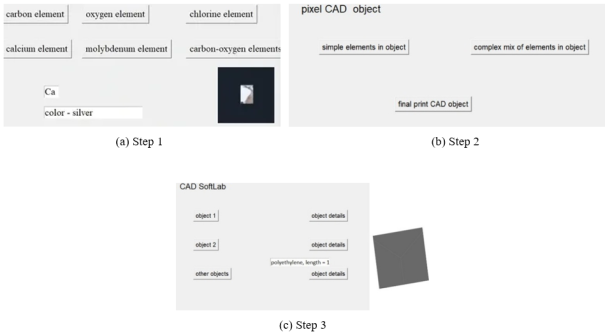
Figure 1. (a) step 1 pixel computer aided design method to simulate chemical periodic table elements, (b) step 2 simulate the printing of the chemical elements for the object at the desired locations, (c) step 3 simulate the list of the objects, samples polyvinyl chloride and transparent polyethylene with the geometry chart details.
3. Results and Discussions
3.1. Optical Camera Image in Millimeter Scale of Polyvinyl Chloride
Figure 2(a) shows the sample 1 polyvinyl chloride of length = 5.5 mm, width = 7 mm and thickness = 3.2 mm. The image is from optical camera. Figure 2(b) shows the simulation matching the experiments. The element pixels, shapes and colors having high resolution are used in the model. The details are given in the supplementary material. The number of pixel elements used are 23. The elements are carbon, chlorine, oxygen, calcium and molybdenum. The confirmation of the elements are obtained from the energy dispersive spectroscopy as shown in Figure 3. (26, 38) pixel resolution is calcium, (6, 13) is chlorine, (22, 14) is molybdenum, (9, 11) is oxygen and (928, 659) is carbon. Our model is different from the Fresnel algorithm . The sample 1 is polyvinyl chloride has image size obtained from the camera (218, 215) pixels. The simulation provides user defined resolution of sample 1 polyvinyl chloride (216, 213) pixels. The experiment camera image of our sample 1 polyvinyl chloride has file size of 4.78 KB. The simulation result of polyvinyl chloride has file size of 4.94 KB. The periodic table of the material elements imaging with the relation to pixels and file size is the scope for the future work. The carbon element is 1, oxygen 10 elements, chlorine 10 elements, calcium 1 element and molybdenum 1 element. The carbon color is dimgray, oxygen color is white gray, chlorine color is sheet white, calcium color is silver and molybdenum color is silver white to match the user resolution camera image of our sample 1 polyvinyl chloride as shown in Figure 2(a).
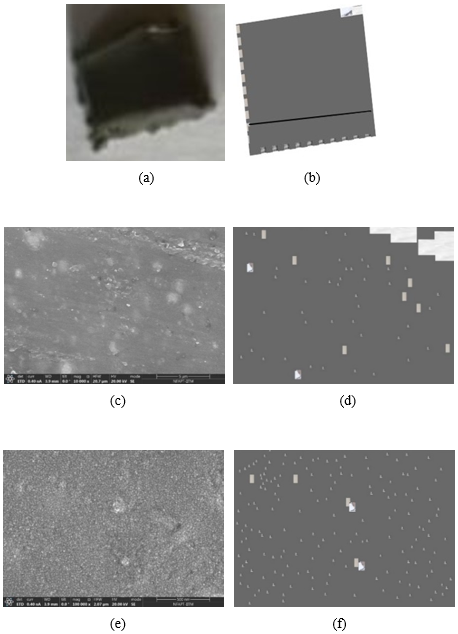
Figure 2. Comparison of (a) optical camera imaging in the millimeter scale resolution of the polyvinyl chloride membrane material with (b) pixel computer aided design method (c) scanning electron microscopy image in micrometer resolution of the polyvinyl chloride with (d) simulation (e) scanning electron microscopy image in nanometer resolution of the polyvinyl chloride with (f) simulation.
3.2. Scanning Electron Microscopy Imaging of the Polyvinyl Chloride in Micrometer Resolution
Figure 2(c) shows the scanning electron microscopy image in micrometer resolution of our sample 1 polyvinyl chloride. The image resolution width is 20.7 μm and height is 20.7 μm. The simulation uses the same shapes and colors of the chemical elements that are used in millimeter resolution simulation to match with the experiment imaging in the micrometer resolution for our sample 1 polyvinyl chloride. The simulation result is shown in Figure 2(d). The code is given in the supplementary material. The number of pixel elements used are 58. (26, 38) pixel resolution is calcium, (17, 36) is chlorine, (110, 66) is molybdenum, (9,11) is oxygen and (928,659) is carbon. The sample 1 is polyvinyl chloride has image size obtained from the scanning electron microscopy in the micrometer resolution (928, 659) pixels. The simulation gives the user defined resolution of our sample 1 polyvinyl chloride (928, 659) pixels. The experiment image of our sample 1 polyvinyl chloride has file size of 93.1 KB. The simulation imaging has file size of 24 KB. The carbon element is 1, oxygen 42 elements, chlorine 8 elements, calcium 2 elements and molybdenum 5 elements. The carbon color is dimgray, oxygen color is white gray, chlorine color is sheet white, calcium color is silver and molybdenum color is silver white to match the micrometer resolution image of our sample 1 polyvinyl chloride.
3.3. Scanning Electron Microscopy Imaging of the Polyvinyl Chloride in Nanometer Resolution
Here we took the image using scanning electron microscopy in nanometer resolution of our sample 1 polyvinyl chloride as shown in Figure 2(e). The image width is 2.07 μm and the height is 2.07 μm as shown in Figure 2(e). The simulation uses the same shapes and colors of the chemical elements as used to match the micrometer image resolution as shown in Figure 2(f). The code is given in the supplementary material. The number of pixel elements used are 178. (26, 38) pixel resolution is calcium, (17, 36) is chlorine, (9, 11) is oxygen and (928, 659) is carbon. The sample 1 is polyvinyl chloride has image size obtained from the scanning electron microscopy in nanometer resolution of (928, 659) pixels. The simulation provides the nanometer resolution of sample 1 polyvinyl chloride (928, 659) pixels. The experiment image of our sample 1 polyvinyl chloride has file size of 105 KB. The simulation imaging for sample 1 of polyvinyl chloride in nanometer resolution has file size of 37 KB. The carbon element is 1, oxygen 171 elements, chlorine 4 elements and calcium 2 elements. The carbon color is dimgray, oxygen color is white gray, chlorine color is sheet white and calcium color is silver to match the nanometer resolution image of our sample 1 polyvinyl chloride.
Figure 3(a) shows the image used to measure the elements composition of our sample 1 polyvinyl chloride. The elements composition is obtained from the energy dispersive spectroscopy. The elements weight (%) and atomic (%) are given in Figure 3(b). The mass of the polyvinyl chloride multiplied by the weight (%) of each element provides each element mass in the sample polyvinyl chloride. For example in the polyvinyl chloride the carbon element weight (%) is 57.8%, mass of the polyvinyl chloride is 160 mg. The resulting mass of the carbon element is 92.5 mg. Figure 3(c) shows the map of the different chemical elements obtained from the energy dispersive spectroscopy available in our sample polyvinyl chloride membrane material.
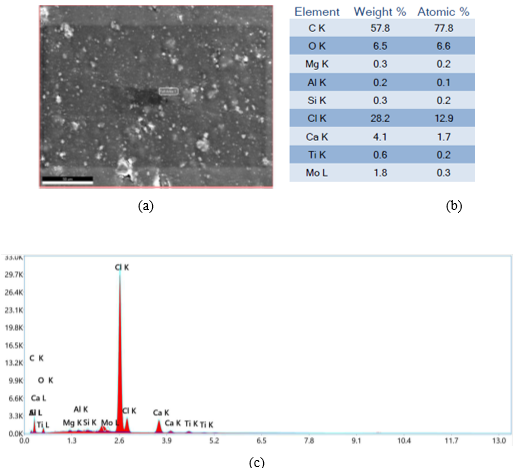
Figure 3. (a) Microimaging used in energy dispersive spectroscopy (b) chemical elements of our sample 1 polyvinyl chloride. The chemical elements includes carbon, oxygen, chlorine, calcium and molybdenum in weight (%) and mol percentage (atomic %). The symbol C is for carbon, O is oxygen, Mg is magnesium, Al is aluminum, Si is silicon, Cl is chlorine, Ca is calcium, Ti is Titanium and Mo is Molybdenum (c) chemical elements map available in our sample polyvinyl chloride obtained from the energy dispersive spectroscopy.
3.4. Optical Camera and Microscopy Imaging in Milli, Micro and Nanometer Resolution for Transparent Polyethylene
Here we consider our sample 2 transparent polyethylene of length = 14 mm, width = 12 mm and thickness = 0.8 mm. Figure 4(a) shows the camera image of the millimeter resolution transparent polyethylene. Figure 4(b) shows the simulation matches the experiments. The number of pixel elements used are 2. The elements are carbon and oxygen. The confirmation of the elements are obtained from the energy dispersive spectroscopy as shown in Figure 4. The code is given in the supplementary material. The python code to construct square dimgray carbon planar x–y geometry plt.plot (0, i, marker='s', markersize=440, color='dimgray') and the thin field lines are constructed with the code plt.plot(0,j, marker='1', markersize=440, color='gray') to match experiments. The camera image of transparent polyethylene has (437, 474) pixels. The simulation image of transparent polyethylene in millimeter resolution is (419, 459) pixels. The experiment camera image of our sample 2 transparent polyethylene has file size of 19 KB. The simulation has file size of 12 KB. The carbon element is 1 and oxygen 1 element. The color of carbon is dimgray and oxygen color is white gray to match the millimeter resolution image of transparent polyethylene.
Figure 4(c) shows the scanning electron microscopy imaging in the micrometer resolution of our sample 2 transparent polyethylene. The image resolution width is 20.7 μm and height is 20.7 μm. Figure 4(d) shows the simulation matches the experiments. The number of pixel elements used are 181. The elements are carbon, oxygen, oxygen splash and carbon–oxygen. (928, 659) pixel resolution is carbon, (9,11) is oxygen, (159, 43) is oxygen splash and (11, 23) is carbon–oxygen. The carbon element is 1, oxygen 157 elements, oxygen splash 4 elements and carbon–oxygen are 19 elements. The color of carbon is dimgray, oxygen color is white gray, oxygen splash color is white gray and carbon–oxygen color is white to match the micrometer resolution required by the user for our sample 2 transparent polyethylene. The code is given in the supplementary material. Our transparent polyethylene in micrometer resolution image has (928, 659) pixels. The simulation image in user needed micrometer resolution is (928, 659) pixels. The experiment image in micrometer resolution of our sample 2 transparent polyethylene has file size of 103 KB. The simulation has file size of 29 KB.
Figure 4(e) shows the transparent polyethylene in nanometer resolution obtained from the scanning electron microscopy. The experiment nanometer resolution image width is 2.07 μm and height is 2.07 μm. Figure 4(f) shows the simulation matches the experiments. The number of pixel elements used are 194. The elements are carbon, oxygen and carbon–oxygen. (928, 659) pixel resolution is carbon, (9,11) is oxygen and (23, 45) is carbon–oxygen. The carbon element is 1, oxygen 182 elements and carbon–oxygen are 11 elements. The color of carbon is dimgray, oxygen is white gray and the carbon–oxygen color is white to match the nanometer resolution image of transparent polyethylene. The code is given in the supplementary material. The nanometer resolution image of the transparent polyethylene is (928, 659) pixels. The simulation image in nanometer resolution is (928, 659) pixels. The experiment image of our sample 2 transparent polyethylene in nanometer resolution has file size of 101 KB. The simulation has file size of 42 KB.
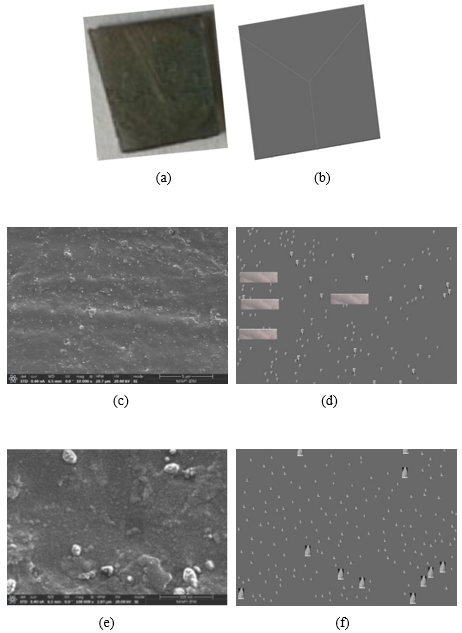
Figure 4. Comparison of (a) optical camera imaging in millimeter resolution of the transparent polyethylene with (b) simulation (c) scanning electron microscopy image in micrometer resolution of the transparent polyethylene with (d) simulation (e) scanning electron microscopy image in nanometer resolution of the transparent polyethylene membrane material with (f) simulation.
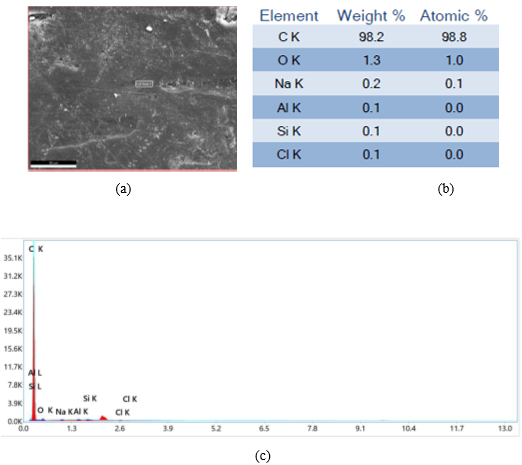
Figure 5. Microimaging used in energy dispersive spectroscopy (b) chemical elements of our sample 2 transparent polyethylene. The chemical elements are carbon and oxygen in weight (%) and mol percentage (atomic %). The symbol C is for carbon, O is oxygen, Na is sodium, Al is aluminum, Si is silicon and Cl is chlorine (c) chemical elements map available in our sample 2 transparent polyethylene obtained from the energy dispersive spectroscopy.
Figure 5(a) shows the micrometer image of the transparent polyethylene used to measure the chemical elements composition from the energy dispersive spectroscopy. The chemical elements weight (%) and atomic (%) are given in Figure 5(b). The mass of the sample 2 transparent polyethylene multiplied by the weight (%) of each element provides each element mass in the sample polyethylene. For example in our transparent polyethylene the carbon element weight (%) is 98.2%, mass of the polyvinyl chloride is 120 mg. The resulting mass of the carbon element is 118 mg. Figure 5(c) shows the map of the different chemical elements obtained from the energy dispersive spectroscopy available in our sample 2 transparent polyethylene membrane material.
4. Precision Balance to Measure Mass Time of the Samples
The mass time measurement of our sample 1 polyvinyl chloride is measured to understand the density mass diagram for materials that includes the polyvinyl chloride and polyethylene. The density is a property that gives the arrangement of chemical elements for the membrane material. The simulation is constructed in steps as discussed in methods section towards this primary objective. The precision mass balance has maximum mass measurement of 1200 g. The precision of the measurement is 0.01 g. Figure 6(a) shows our sample 1 polyvinyl chloride is placed on the precision balance. Figure 6(b) shows our sample polyvinyl chloride is placed on the precision balance that is shielded by the acrylic box. We observe the mass is steady for our sample polyvinyl chloride when the acrylic box is used to shield the precision balance. The streamline flow is blocked for the air molecules to disturb the mass balance. The mass is steady for the polyvinyl chloride. The mass measurement is 160 mg for polyvinyl chloride as shown in Figure 6(c). The measurement time is 12 seconds. Our sample polyvinyl chloride has length of 5.5 mm, width 7 mm and thickness is 3.2 mm. The density of our sample 1 polyvinyl chloride is 1300 kg/m3 in agreement with the literature . Figure 6(c) shows the mass of our polyvinyl chloride fluctuates from 320 mg to 560 mg without the acrylic box to shield the precision mass balance.
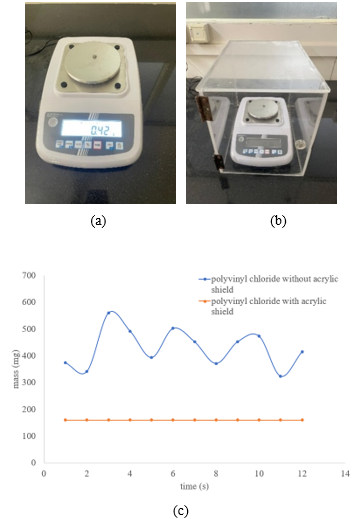
Figure 6. Precision balance mass time measurement of our sample 1 polyvinyl chloride (a) without the acrylic box to shield the precision mass balance measurement (b) with the acrylic box to shield the mass balance measurement (c) comparison of the mass time measurement of sample 1 polyvinyl chloride without the acrylic box and with the acrylic box to shield the mass balance measurement.
We calculate the moles in milli, micro and nanometer scale for our sample 1polyvinyl chloride. We consider Avogadro number = 6.023×10²³ mol-1
mole of polyvinyl chloride in millimeter object scale = 236.023×1023= 3.82×10⁻²³ mol
mole of polyvinyl chloride in micrometer resolution scale = 586.023×1023=9.63×10⁻²³ mol
mole of polyvinyl chloride in nanometer resolution scale = 1786.023×1023=2.96×10⁻²² mol
The moles establishes the visual representation in simulation to develop in future the relation with the computer property chart that includes the file size, data transfer and memristors.
We calculate from the mol obtained in the millimeter object scale the concentration of our sample 1 polyvinyl chloride membrane material = 3.82×10-231.23×10-7=3.1×10⁻¹⁶ mM
Figure 7(a) shows our sample 2 transparent polyethylene kept on the mass balance. Figure 7(b) shows our transparent polyethylene kept on the mass balance with acrylic box to shield the mass balance. Figure 7(c) shows the mass of the transparent polyethylene fluctuates from 60 mg to 350 mg without acrylic box to shield the mass balance. Figure 7(c) shows the steady mass measurement of the transparent polyethylene of 120 mg with the acrylic box to shield the mass balance. Our sample 2 transparent polyethylene has length of 14 mm, width 12 mm and thickness 0.8 mm. The density of our sample 2 transparent polyethylene is 893 kg/m3 in agreement with the literature .
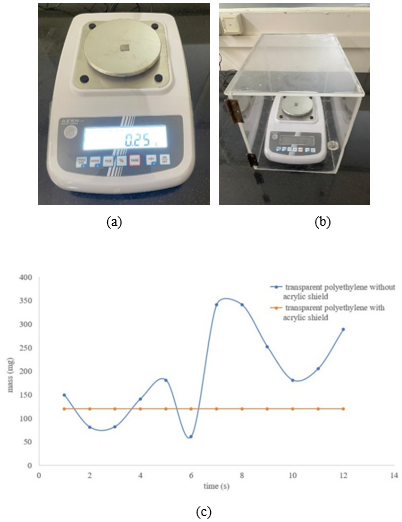
Figure 7. Precision balance mass time measurement of our sample 2 transparent polyethylene membrane material (a) without the acrylic box to shield the mass balance (b) with the acrylic box to shield the mass balance (c) comparison of the mass time measurement of sample 2 transparent polyethylene membrane material without the acrylic box and with the acrylic box to shield the mass balance.
We calculate the moles in milli, micro and nanometer scale for our sample 2 transparent polyethylene.
mole of transparent polyethylene in millimeter object scale = 26.023×1023= 3.32×10⁻²⁴ mol
mole of transparent polyethylene in micrometer resolution scale = 1816.023×1023=3×10-22 mol
mole of transparent polyethylene in nanometer resolution scale = 1946.023×1023=3.2×10⁻²² mol
We calculate from the mol obtained in the millimeter object scale the concentration of our sample 2 transparent polyethylene membrane material = 3.32×10⁻²⁴ 1.34×10-7=2.48×10⁻¹⁷ mM
The computer based understanding of polyvinyl chloride are studied in the literature. The polyvinly chlroide is the sample. It is the structure of the sample that are investigated . In this paper we develop the arrangement of the molecules of the sample to enhance the match with the scanning electron microscopy experiments.
5. Conclusions
We provide a technique to obtain the mass measurement of polymers. Here we use precision mass balance measurement device. The mass balance is shielded with the acrylic box. We obtain steady mass time with the technique. We tested the technique to obtain steady mass for our two samples polyvinyl chloride and polyethylene. We observe the technique provides density for our samples that has simple geometry. Here we develop pixel method to match the experiment image of our samples from milli, micrometer and nanometer resolution. In this method we provide exact match with the shape and color of each periodic table material present in our samples. Our simulation provides exact match with the locations of each periodic table materials in our sample 1 polyvinyl chloride and sample 2 polyethylene. Our pixel method matches the count of each periodic table materials that is available in the sample 1 polyvinyl chloride and sample 2 polyethylene. The method on tailoring with the chemical elements provides exact match with the samples. The optimized device with no work function to correlate the distribution of the periodic table materials arrangement in the samples gives the scope to industrial fabrication level. The method provides opportunity to energy, fluidic circuits, cool fluidic displays, cool fluidic printers and material thermal management coolants applications.
Abbreviations

CAD

Computer Aided Design

SEM

Scanning Electron Microscopy

EDS

Energy Dispersive Spectroscopy

DISC

Dopant Induced Solubility Control

Acknowledgments
The authors like to acknowledge the financial support from the Ministry of Human Resource Development (MHRD), Government of India (GOI) via STARS grant[STARS/APR2019/148] and Department of Science and Technology (DST) GOI via CRG grant[CRG/2020/001684] and IoE-CoE Micro Nano-Bio Fluidics group.
Data Availability Statement
The data is available from the corresponding author upon reasonable request.
Conflicts of Interest
The authors declare no conflicts of interest.
References
[1] J. Heikenfeld, K. Zhou, E. Kreit, B. Raj, S. Yang, B. Sun, A. Milarcik, L. Clapp, R. Schwartz, Electrofluidic displays using Young-Laplace transposition of brilliant pigment dispersions, Nature Photonics, 3, 292-296, 2009.
[2] C. G. Salzmann, J. S. Loveday, A. R. Finsen, Craig L. Bull, Structure and nature of ice XIX, Nature Communications, 12, 1-7, 2021.
[3] L. D. Rosso, M. Celli, F. Grazzi, M. Catti, T. C. Hansen, A. D. Fortes, L. Ulivi, Cubic ice without stacking defects obtained from ice XVII, Nature Materials, 19, 663-668, 2020.
[4] C. G. Salzmann, B. J. Murray, Ice goes fully cubic, Nature Materials, 19, 586-587, 2020.
[5] M. Hertzog, M. Wang, J. Mony, K. Borjesson, Strong light-matter interactions: a new direction within chemistry, Chem. Soc. Rev., 48, 937-961, 2019.
[6] M. Nase, A. Zankel, B. Langer, H. J. Baumann, W. Grellmann, P. Poelt, Investigation of the peel behavior of polyethylene/polybutene-1 peel films using in situ peel tests with environmental scanning electron microscopy, Polymer, 49, 5458-5466, 2008.
[7] S. Das, M. Muthukumar, Thermal conduction and phonon transport in folded polyethylene chains, Macromolecules, 56, 393-403, 2023.
[8] T. Walther, Recent improvements in quantification of energy-dispersive X-ray spectra and maps in electron microscopy of semiconductors, Applied Research, 3, 1-11, 2024.
[9] V. V. R. Nandigana, Pixel imaging method, transport phenomenon in sizes from nano, micro, and milli scale pore membrane, Engineering Reports, 7, 1-12, 2025.
[10] P. W. Wachulak, M. C. Marconi, R. A. Bartels, C. S. Menoni, J. J. Rocca, Holographic imaging with a nanometer resolution using compact table-top EUV Laser, Opto-Electronics Review 18, 80-90, 2010.
[11] X. Michalet, F. F. Pinaud, L. A. Bentolila, J. M. Tsay, S. Doose, J. J. Li, G. Sundaresan, A. M. Wu, S. S. Gambhir, S. Weiss, Quantum Dots for Live Cells, In Vivo Imaging, and Diagnostics, Science, 307, 538-544, 2005.
[12] Muthukumar, Screening effect on viscoelasticity near the gel point, Macromolecules, 22, 4656-4658, 1989.
[13] X. Wang, V. Ho, R. A. Segalman, D. G. Cahill, Thermal conductivity of high-modulus polymer fibers. Macromolecules, 46, 4937-4943, 2013.
[14] J. Hennig, Anisotropy and structure in uniaxially stretched amorphous high polymers, Journal of Polymer Science Part C: Polymer Symposia. 16, 2751-2761, 1967.
[15] T. Ebbinghaus, G. Lang, T. Scheibel, Biomimetic polymer fibers-function by design, Bioinspiration & Biomimetics, 18, 1-29, 2023.
[16] R. E. Wetton, J. L. Duncan, Design of polymers for viscoelastic damping applications, J. Acoust. Soc. Am, 86, S51, 1989.
[17] G. Menges, N. Berndtsen, Polyvinyl chloride-Processing and structure, Pure and Applied Chemistry, 49, 597-613, 1977.
[18] C. A. Jones, S.A. Gordeyev, S.J. Shilton, Poly(vinyl chloride) (PVC) hollow fibre membranes for gas separation, Polymer, 52, 901-903, 2011.
[19] R. Kumar, W. Li, B. G. Sumpter, M. Muthukumar, Understanding the effects of dipolar interactions on the thermodynamics of diblock copolymer melts, J. Chem. Phys. 151, 054902 2019.
[20] A. A. Teran, N. P. Balsara, Thermodynamics of block copolymers with and without salt, J. Phys. Chem. B, 118, 4-17, 2014.
[21] B. Frank, A. P. Gast, T. P. Russell, H. R. Brown, C. Hawker, Polymer Mobility in Thin Films, Macromolecules, 29, 6531-6534, 1996.
[22] K. Feldman, T. Tervoort, P. Smith, N. D. Spencer, Toward a Force Spectroscopy of Polymer Surfaces, Langmuir, 14, 372-378, 1998.
[23] J. H. Butler, D. C. Joy, G. F. Bradley, S. J. Krause, Low-voltage scanning electron microscopy of polymers, Polymer, 36, 1781-1790, 1995.
[24] M. Avella, E. Martuscelli, P. Greco, Crystallization behavior of poly(ethylene oxide) from poly(3-hydroxybutyrate)/poly(ethylene oxide) blends: phase structuring, morphology and thermal behavior, Polymer, 32, 1647-1653, 1991.
[25] J. Euvrard, A. Revaux, P. A. Bayle, M. Bardet, D. Vuillaume, A. Kahn, The formation of polymer-dopant aggregates as a possible origin of limited doping efficiency at high dopant concentration, Organic Electronics, 53, 135-140, 2018.
[26] R. H. Baughman, J. L. Bredas, R. R. Chance, R. L. Elsenbaumer, L. W. Shacklette, Structural basis for semiconducting and metallic polymer dopant systems, Chemical Reviews, 82, 209-222, 1982.
[27] Z. I. B. Valdez, R. Xiao, C. Cendra, A. S. Fergerson, Z. Chen, G. Gonel, A. Salleo, D. Yu, A. J. Moule, Reversible doping and photo patterning of polymer nanowires, Advanced Electronic Materials, 6, 1-10, 2020.
[28] E. Jacobs, J. Li, S. L. Burg, D. J. Bilsky, B. T. Rotondo, M. P. Augustine, P. Stroeve, A. J. Moule, Reversible optical control of conjugated polymer solubility with sub-micrometer resolution, ACS Nano, 9, 1905-1912, 2015.
[29] C. D. Muller, A. Falcou, N. Reckefuss, M, Rojahn, V. Wiederhirn, P. Rudati, H. Frohne, O. Nuyken, H. Becker, K. Meerholz, Multi-colour organic light-emitting displays by solution processing, Nature, 421, 829-833, 2003.
[30] D. Gentili, M. Bolognesi, M. Baldoni, F. Mercuri, M. Muccini, M. Cavallini Submicrometer spatially controlled doping of polymer thin films by a single-step soft-contact approach, ACS Applied Electronic Materials, 5, 6996-7003, 2023.
[31] K. Blankenbach, A. Schmoll, A. Bitman, F. Bartels, D. Jerosch, Novel highly reflective and bistable electrowetting displays, J. Soc. Inf. Display 16, 237-244, 2008.
[32] J. Sun, X. Liao, A. M. Minor, N. P. Balsara, R. N. Zuckermann. Morphology-conductivity relationship in crystalline and amorphous sequence-defined peptoid block copolymer electrolytes, Journal of the American Chemical Society, 136, 14990-14997, 2014.
[33] M. Seidler, T. Yu, X. Luo, D. Prendergast, R. N. Zuckermann, X. Jiang, N. P. Balsara, Atomic-scale imaging of condensed counterions, Macromolecules, 57, 10016-10022, 2024.
[34] M. Muthukumar, C. K. Ober, and E. L. Thomas, Competing interactions and levels of ordering in self-organizing polymeric materials, Science, 277, 1225-1232, 1997.
[35] A. Marathianos, A. Magiakos, Y. Han, A. Sanchez, R. Whitfield, J. Kammerer, A. Anastasaki, P. Wilson, J. P. Patterson, C. B. Kowollik, E. Liarou, Atomic-scale imaging of polymers and precision molecular weight analysis, Journal of the American Chemical Society, 146, 34292-34297, 2024.
[36] M. J. Miles, K. D. Jandt, T. J. McMaster, R. L. Williamson, Atomic force microscopy of polymer single crystals and melt-drawn films, Colloids and Surfaces A: Physicochemical and Engineering Aspects, 87, 235-243, 1994.
[37] A. Turner, M. Filella, Polyvinyl chloride in consumer and environmental plastics, with a particular focus on metal-based additives, Environ. Sci.: Processes Impacts, 23, 1376-1384, 2021.
[38] H. Jiang, E. A. Medina, E. E. Stache, Upcycling Poly(vinyl chloride) and Polystyrene Plastics Using Photothermal Conversion, J. Am. Chem. Soc. 147, 2822-2828, 2025.
[39] A. Rahimi, J. M. Garcia, Chemical recycling of waste plastics for new materials production, Nature Reviews Chemistry, 1, 1-11, 2017.
[40] G. A. Mortimer, W. F. Hamner, Density of polyethylene, Journal of Polymer Science Part A: General Papers, 2, 1301-1309, 1964.
[41] C. Unger, H. Schmalz, J. Lipp, W. P. Kretschmer, R. Kempe, A Closed-loop recyclable low-density polyethylene, Advanced Science, 11, 1-5, 2024.
[42] M. Eck, S. T. Schwab, T. F. Nelson, K. Wurst, S. Iberl, D. Schleheck, C. Link, G. Battagliarin, S. Mecking, Biodegradable high-density polyethylene-like material, Angewandte Chemie, 62, 1-4, 2023.
[43] UK Physical Sciences Centre, HEA (National Teaching Fellowship).Available from:
Cite This Article
  • APA Style

    Vishal, N. V. R., Krishnan, S. (2026). Pixel Computer Aided Design (CAD) Method to Understand Mass Measurements, Imaging in Milli, Micro and Nanometer Resolution. International Journal of Materials Science and Applications, 15(1), 15-25. https://doi.org/10.11648/j.ijmsa.20261501.12

    Copy | Download

    ACS Style

    Vishal, N. V. R.; Krishnan, S. Pixel Computer Aided Design (CAD) Method to Understand Mass Measurements, Imaging in Milli, Micro and Nanometer Resolution. Int. J. Mater. Sci. Appl. 2026, 15(1), 15-25. doi: 10.11648/j.ijmsa.20261501.12

    Copy | Download

    AMA Style

    Vishal NVR, Krishnan S. Pixel Computer Aided Design (CAD) Method to Understand Mass Measurements, Imaging in Milli, Micro and Nanometer Resolution. Int J Mater Sci Appl. 2026;15(1):15-25. doi: 10.11648/j.ijmsa.20261501.12

    Copy | Download

  • @article{10.11648/j.ijmsa.20261501.12,
      author = {Nandigana Venkata Raghavendra Vishal and Sivarama Krishnan},
      title = {Pixel Computer Aided Design (CAD) Method to Understand Mass Measurements, Imaging in Milli, Micro and Nanometer Resolution},
      journal = {International Journal of Materials Science and Applications},
      volume = {15},
      number = {1},
      pages = {15-25},
      doi = {10.11648/j.ijmsa.20261501.12},
      url = {https://doi.org/10.11648/j.ijmsa.20261501.12},
      eprint = {https://article.sciencepublishinggroup.com/pdf/10.11648.j.ijmsa.20261501.12},
      abstract = {In this article we measure the steady mass for our samples polyvinyl chloride and polyethylene. The constant mass is achieved when the acrylic box is used to shield the precision mass balance. The mass of our sample 1 polyvinyl chloride is 160 mg. Our sample 1 polyvinyl chloride is thin film of length 5.5 mm, width 7 mm and thickness 3.2 mm. The density of the polyvinyl chloride is 1300 kg/m3 in agreement with the literature. The stream flow is blocked when the acrylic shield is used. We observe fluctuations in the mass from 320 mg to 560 mg when there is no acrylic shield. The mass of our sample 2 polyethylene is 120 mg and the density is 893 kg/m3 with the acrylic shield. The mass of the polyethylene membrane material fluctuates from 60 mg to 350 mg without the acrylic shield. The geometry of our sample 2 polyethylene is length 14 mm, width 12 mm and thickness 0.8 mm. Further we build pixel computer aided design (CAD) model to correlate with the chemical elements in the periodic table towards exact match with the optical camera image of our two samples that are polyvinyl chloride and polyethylene. Furthermore we build the model to exact match to the scanning electron microscopy (SEM) in micrometer and nanometer resolution to both samples. The chemical periodic table elements are obtained from energy dispersive spectroscopy (EDS). The study of membrane materials can find applications towards energy and thermal management coolants.},
     year = {2026}
    }
    

    Copy | Download

  • TY  - JOUR
    T1  - Pixel Computer Aided Design (CAD) Method to Understand Mass Measurements, Imaging in Milli, Micro and Nanometer Resolution
    AU  - Nandigana Venkata Raghavendra Vishal
    AU  - Sivarama Krishnan
    Y1  - 2026/01/30
    PY  - 2026
    N1  - https://doi.org/10.11648/j.ijmsa.20261501.12
    DO  - 10.11648/j.ijmsa.20261501.12
    T2  - International Journal of Materials Science and Applications
    JF  - International Journal of Materials Science and Applications
    JO  - International Journal of Materials Science and Applications
    SP  - 15
    EP  - 25
    PB  - Science Publishing Group
    SN  - 2327-2643
    UR  - https://doi.org/10.11648/j.ijmsa.20261501.12
    AB  - In this article we measure the steady mass for our samples polyvinyl chloride and polyethylene. The constant mass is achieved when the acrylic box is used to shield the precision mass balance. The mass of our sample 1 polyvinyl chloride is 160 mg. Our sample 1 polyvinyl chloride is thin film of length 5.5 mm, width 7 mm and thickness 3.2 mm. The density of the polyvinyl chloride is 1300 kg/m3 in agreement with the literature. The stream flow is blocked when the acrylic shield is used. We observe fluctuations in the mass from 320 mg to 560 mg when there is no acrylic shield. The mass of our sample 2 polyethylene is 120 mg and the density is 893 kg/m3 with the acrylic shield. The mass of the polyethylene membrane material fluctuates from 60 mg to 350 mg without the acrylic shield. The geometry of our sample 2 polyethylene is length 14 mm, width 12 mm and thickness 0.8 mm. Further we build pixel computer aided design (CAD) model to correlate with the chemical elements in the periodic table towards exact match with the optical camera image of our two samples that are polyvinyl chloride and polyethylene. Furthermore we build the model to exact match to the scanning electron microscopy (SEM) in micrometer and nanometer resolution to both samples. The chemical periodic table elements are obtained from energy dispersive spectroscopy (EDS). The study of membrane materials can find applications towards energy and thermal management coolants.
    VL  - 15
    IS  - 1
    ER  - 

    Copy | Download

Author Information